Table of Contents
Google’s PageSpeed Insights is a free performance measurement tool. It examines a web page’s content for desktop and mobile devices. It generates a single number score (ranging from 1 to 100) that summarizes several underlying performance metrics. Stop right now and run PageSpeed Insights on your website if you haven’t already. It’s a significant factor in how Google evaluates and ranks your website.
Don’t get too worked up if your PageSpeed Insights score is below 80. You’re not on your own. Many websites are not performance-optimized. The good news is that you can take steps to improve your score right away.
PageSpeed Insights will show you which issues are causing your page to load slowly. However, you may require additional assistance to resolve these issues. We’ll show you how to fix four common image problems in the sections below. We also demonstrate how ImageEngine, an image CDN, can help you simplify, automate, and deliver the best image optimization solution.
Performance Drives Google SEO Rankings
What is the significance of the PageSpeed Insights score and performance? Isn’t it true that content relevance, backlinks, and domain authority all play a role in SEO ranking? Yes, but performance is more important now than it was a year ago. Google began including performance metrics in the factors that influence search engine rankings in 2021. Performance is making a difference in keyword search engine rankings in a market where websites are constantly jockeying to match their competition’s pages (for content relevance, keywords, and other SEO issues).
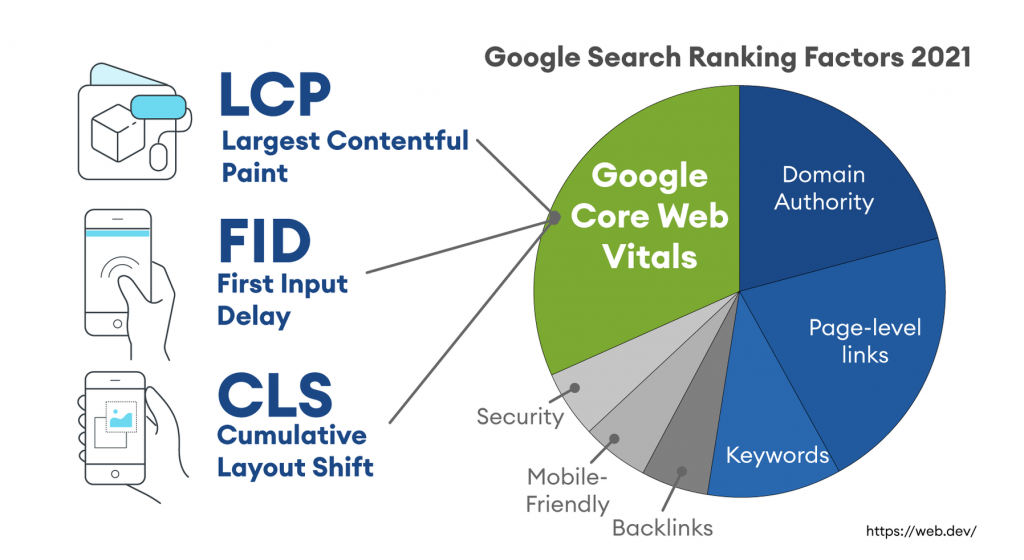
What Are Core Web Vitals Metrics?
Core Web Vitals are a set of performance metrics used by PageSpeed Insights. These are the metrics:
Largest Contentful Paint (LCP):
The render time (in seconds) of the largest image or text block is visible within the viewport is a percentage of the time it took the page to load. The hero image at the top of the page is usually the largest image.
First Input Delay (FID):
The time between when a user interacts with a page for the first time (i.e. when they click a link, tap a button, or use a custom JavaScript-powered control) and when the browser is able to start processing event handlers in response to that interaction.
Cumulative Layout Shift (CLS):
Measures the shift in a layout that occurs when a visible element moves from one rendered frame to the next.
Images and JavaScript are the Main Culprits
PageSpeed Insights categorizes issues according to how they affect these Core Web Vitals metrics. JavaScript and images are the top two reasons why you might have a low score.
Issues with JavaScript are usually caused by code that either blocks or delays the loading of a page. Lazy-loading images, for example, may involve JavaScript that prevents the page from loading. Use a third-party JavaScript library to manage image loading as a rule of thumb. The built-in image loading features of the browser are frequently broken by these libraries. Because the browser starts the download later and must first execute the JavaScript, lazy-loading may cause above-the-fold images to load slower (longer LCP).
Another issue with JavaScript is code that is too long or unnecessary for the page. To put it another way, code bloat. On the internet, there are numerous resources for resolving these issues. However, we will concentrate on image issues in this blog.
Poor performance is caused in large part by images. In 2021, the average website payload will be 2MB, with images accounting for half of that. Images are frequently larger than they need to be and can be reduced in size without sacrificing quality if done correctly.
Four Image Issues Highlighted by PageSpeed Insights
Largest Contentful Paint is the primary metric impacted by images. PageSpeed Insights frequently recommends the following four pieces of advice:
- Serve images in next-gen formats.
- Efficiently encode images.
- Properly size images.
- Avoid enormous network payloads.
That advice seems straightforward. Google provides some great advice on how to deal with images in its dev community. It can be summarized in the following steps:
- Select the appropriate file format.
- Apply the appropriate image compression.
- Apply the right display size.
- Render the image.
- Write responsive image code to select the right variant of the image.
Google’s method is known as “Build-Time Responsive Syntax.” You can probably live with this approach if you have a relatively static website that doesn’t generate new pages or change out images on a regular basis. However, if you have a large, dynamic site with a lot of images, you’ll quickly notice the drawbacks of this method. Developers should strive to automate this image process, according to Google. Why? Because the procedure has a number of significant workflow flaws:
- Adds storage requirements due to a large increase in image variants.
- Increases code bloat and introduces more code complexity.
- Requires developers’ time and effort to create variants and implement responsiveness.
- Requires logic to account for different browser’s support for next-gen image formats.
- Doesn’t adapt to different contexts. It relies on best-guess (breakpoints) of what device visits the web page.
- Needs a separate CDN to further increase delivery speeds.
- Requires ongoing maintenance to adapt to new devices, breakpoints, image formats, markets, and practices.
Key Steps to Achieving High-Performance Images
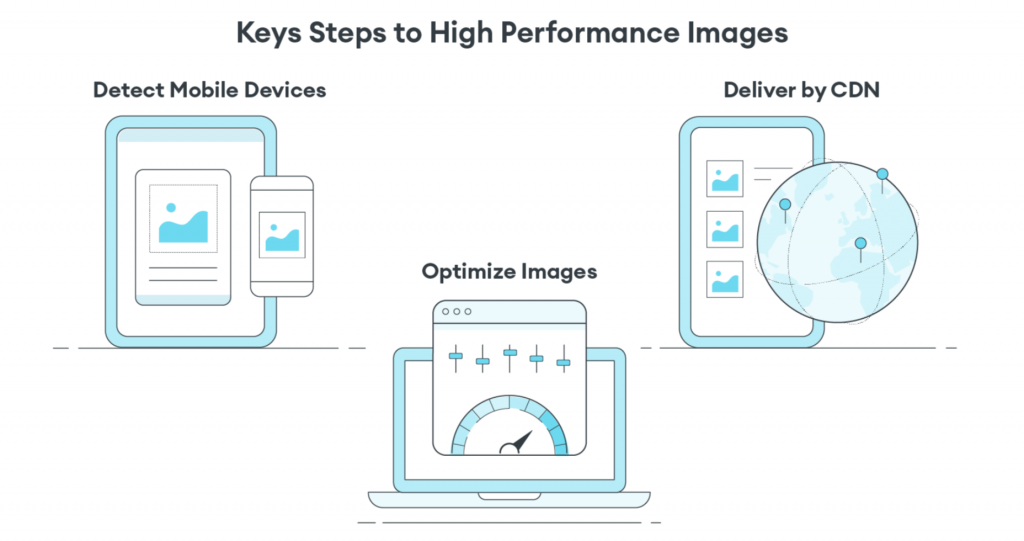
An automated image CDN solution can address all of the image issues raised by PageSpeed Insights instead of using the Build-Time Responsive Syntax approach. The following are the key steps to look for in an image CDN:
- Detect Mobile Devices: The device model and technical capabilities of a website visitor are detected. OS version, browser version, screen pixel density, screen resolution width and height, and support for next-generation image and video formats are among them. This is where ImageEngine stands out from the competition. To improve image optimization, ImageEngine employs true mobile device detection. It has a significant impact on the image optimization process’ effectiveness.
- Optimize Images: The device’s parameters will be used by an image CDN to automatically resize, compress, and convert large original images into optimized images using next-generation file formats like WebP and AVIF. An image CDN, such as ImageEngine, can frequently reduce the image payload by up to 80%.
- Deliver by CDN: Image CDNs, such as ImageEngine, have edge servers strategically placed throughout the world. It often provides a 50 percent faster web page download time than traditional CDNs by pushing optimized images closer to requesting customers and delivering them immediately from the cache.
Results.
The majority of ImageEngine users notice a significant improvement in LCP metrics, as well as a significant improvement in the overall PageSpeed Insights score. Before and after image optimization, ImageEngine offers a free demo analysis of your images. In many cases, developers notice significant improvements in their LCP and Speed Index.
In summary, better performance leads to higher search rankings and a better user experience, as well as increased eCommerce website conversions. More sales and conversions, a streamlined workflow, and lower CDN delivery costs will all pay for the steps you take to improve your image performance.




Add your first comment to this post